BootStrapping
This post demonstrate how bootstrapping, a resample simulation method, can be helpful
example I: estimating mean of a normal distribution
this example shows how bootstrap can be used to improve statistic inference. We’d like to estimate the mean a large population (pop_size) following a normal distribution. Assuming we have a small sample_size = 50
import random

import numpy as np
import matplotlib.pyplot as plt
import scipy

def bootstrapping(sampledata,n_resample,statfcn):
    stat = []
    for i in range(n_resample):
        resample = np.random.choice(sampledata,len(sampledata),replace=True)
        stat.append(statfcn(resample))
    plt.hist(stat)
    mean = np.mean(stat)
    low = np.percentile(stat,2.5)
    high = np.percentile(stat,97.5)
    print('bootstrapping stat(95% CI) is',(mean,low,high))
    return stat
pop_size = 2000000
sample_size = 50
u = 10.56
sigma = 2

pop = np.random.normal(u,sigma,pop_size)
sample = np.random.choice(pop,sample_size)

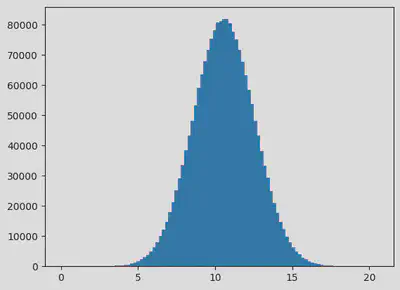
plt.hist(pop,bins=100)
print('population mean and std is', (pop.mean(),pop.std()))
population mean and std is (10.559044870193906, 1.9994262173899353)
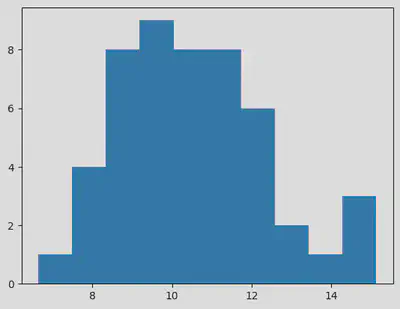
plt.hist(sample)
sigma = np.std(sample,ddof=1)/np.sqrt(sample_size)
print('point estimate for mean is', (sample.mean(),sample.mean()-1.96*sigma,sample.mean() + 1.96*sigma))
point estimate for mean is (10.565477680273876, 10.032426039214945, 11.098529321332807)
statfcnEval = np.mean
sample_boot = bootstrapping(sampledata=sample,n_resample = 20000,statfcn=statfcnEval)
bootstrapping stat(95% CI) is (10.564615348142604, 10.04265523026029, 11.101098050304966)
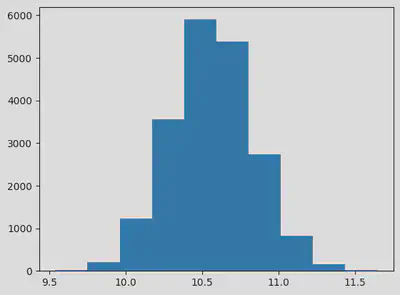
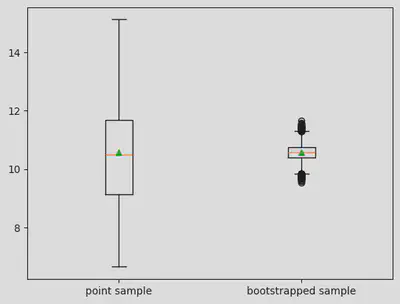
bootstrapping and point estimate give similiar results. However, point estimate heavily relies on the model (normal distribution) property. If we check the boxplot of the sample/resample histogram. We can see how bootstrapping has helped to “narrow down” the distribution of mean, which is what we care about
plt.boxplot([sample,sample_boot],showmeans=True,labels=['point sample','bootstrapped sample'])
{'whiskers': [<matplotlib.lines.Line2D at 0x142414be0>,
  <matplotlib.lines.Line2D at 0x142414bb0>,
  <matplotlib.lines.Line2D at 0x1423b44c0>,
  <matplotlib.lines.Line2D at 0x1423b4610>],
 'caps': [<matplotlib.lines.Line2D at 0x142414760>,
  <matplotlib.lines.Line2D at 0x142444370>,
  <matplotlib.lines.Line2D at 0x1424ae220>,
  <matplotlib.lines.Line2D at 0x1424ae100>],
 'boxes': [<matplotlib.lines.Line2D at 0x142414fd0>,
  <matplotlib.lines.Line2D at 0x1423b4fa0>],
 'medians': [<matplotlib.lines.Line2D at 0x142444c40>,
  <matplotlib.lines.Line2D at 0x1424ae7c0>],
 'fliers': [<matplotlib.lines.Line2D at 0x1423b4cd0>,
  <matplotlib.lines.Line2D at 0x1424aeb50>],
 'means': [<matplotlib.lines.Line2D at 0x142444b80>,
  <matplotlib.lines.Line2D at 0x1424ae6d0>]}
Use the scipy’s bootstrap class will give similiar results
res = scipy.stats.bootstrap(data=(sample,),statistic=np.mean,n_resamples=10000,method='percentile')
res.confidence_interval
ConfidenceInterval(low=10.056358097601994, high=11.102709717993129)
example II: estimating the 95th percentile of a normal distribution
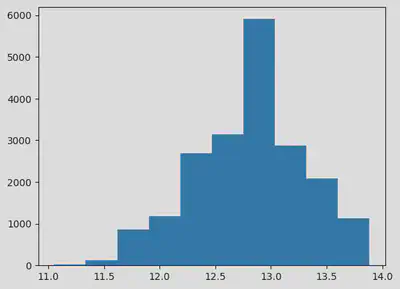
In this case we use the same population. Instead of estimating its mean, we want to estimate how large is the 95th percentile, its very easy to use bootstrapping
# tail_pop = pop[pop > np.percentile(pop,95)]
# pop2 = pop
# plt.hist(pop2,bins=100)
statfcnEval = lambda x:np.percentile(x,95)
print('the population\'s 95th percentile is', statfcnEval(pop))
the population's 95th percentile is 13.847494038352693
sample = np.random.choice(pop,sample_size)

# plt.hist(pop,bins=100)
# print('population mean and std is', (pop.mean(),pop.std()))
sample_bt = bootstrapping(sampledata=sample,n_resample = 20000,statfcn=statfcnEval)
bootstrapping stat(95% CI) is (12.811661723374426, 11.796301224645813, 13.669836644525903)
# plt.boxplot([sample,sample_bt],meanline=True,labels=['point estimation','bootstrapping'],showmeans=True)
res = scipy.stats.bootstrap(data=(sample,), statistic=statfcnEval, n_resamples=10000,method='percentile')
res.confidence_interval
ConfidenceInterval(low=11.796301224645813, high=13.669836644525903)